Published on Monday, 2018-04-02 at 12:00 UTC
Serverless Monitoring of Apps & Websites with AWS Lambda
Could this be the easiest, cheapest, most reliable way to monitor websites and API endpoints?
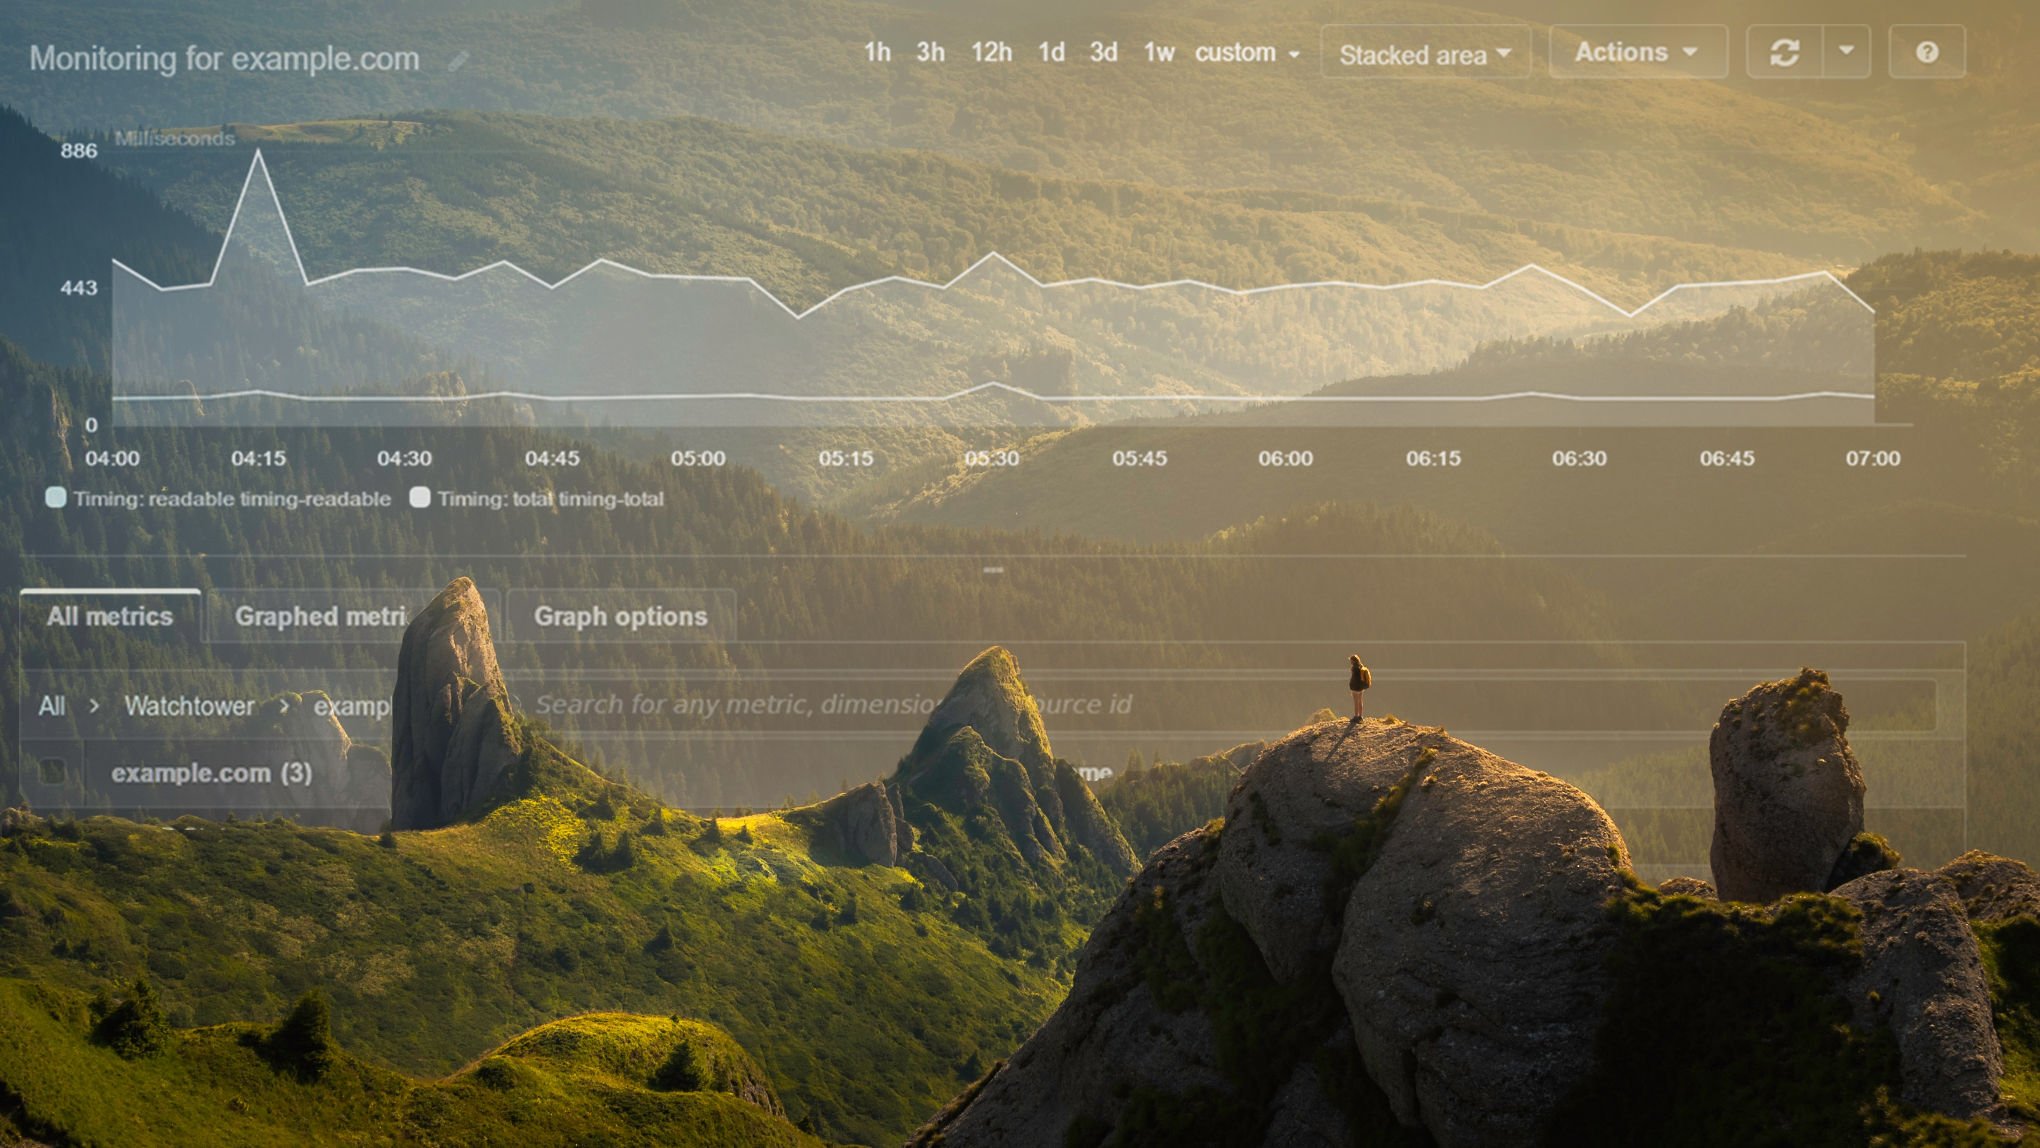
A traveler watching monitoring stats on AWS CloudWatch. (priginal photo by David Marcu on Unsplash)
When you run a website, a web app or some other kind of service on the Internet, it is always a good idea to keep an eye on its availability and performance. Obviously, you don’t want to manually check in every hour to see if everything is still up and running. Let’s automate this!
This guide is going to walk you through setting up monitoring for one or several HTTP(S) endpoints. We are going to do this using two AWS services: AWS Lambda and AWS CloudWatch. Lambda is Amazon’s serverless computing offer which allows you to perform one-off executions of small functions, and pay only for actual execution time. CloudWatch is a service originally designed for monitoring EC2 instances. Instead, we’re going to use it to keep logs for our custom HTTP(S) endpoints which don’t need to be hosted on AWS.
Thanks to this setup, monitoring multiple endpoints is super-reliable and costs next-to-nothing.
Creating an IAM Role
Before we can get started, we need to set up an IAM Role. IAM Roles are AWS’s way of declaring permissions for accessing other services and resources.
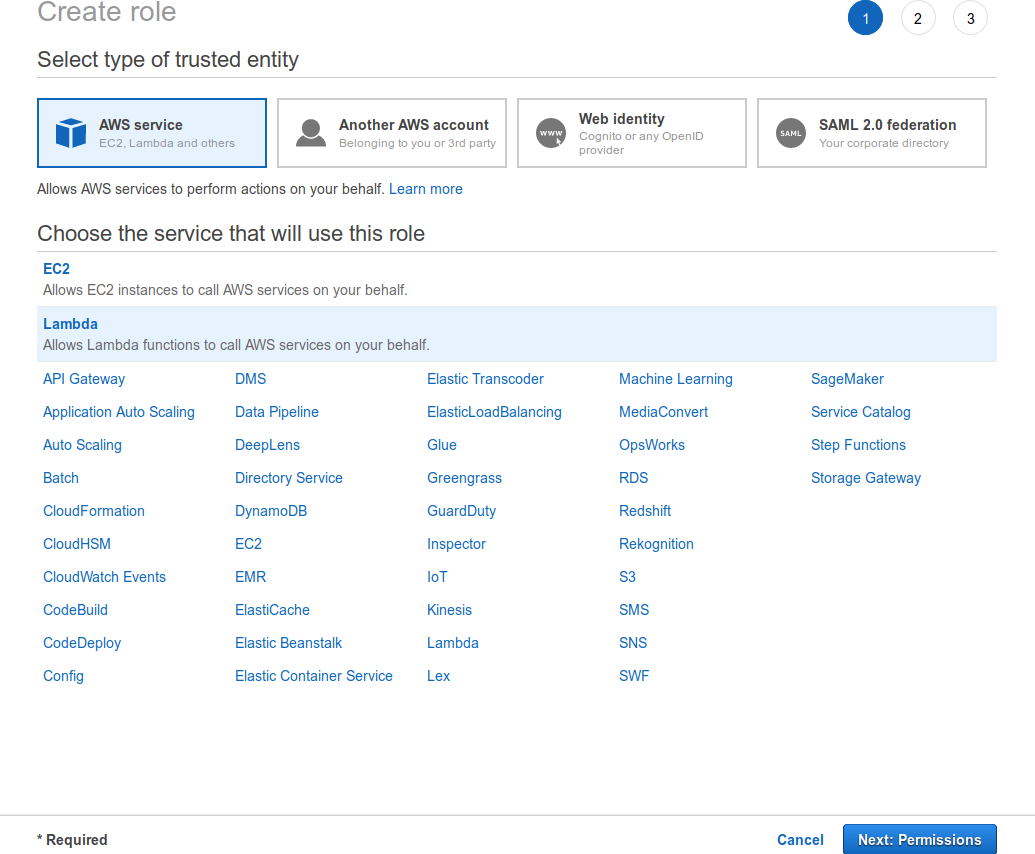
In order to create the new role, go to your AWS dashboard and select the IAM service. Then select “Roles” in the left-hand menu and click on the “Create role” button. Next you need to select which service is going to use this role. In our case, this is going to be Lambda.
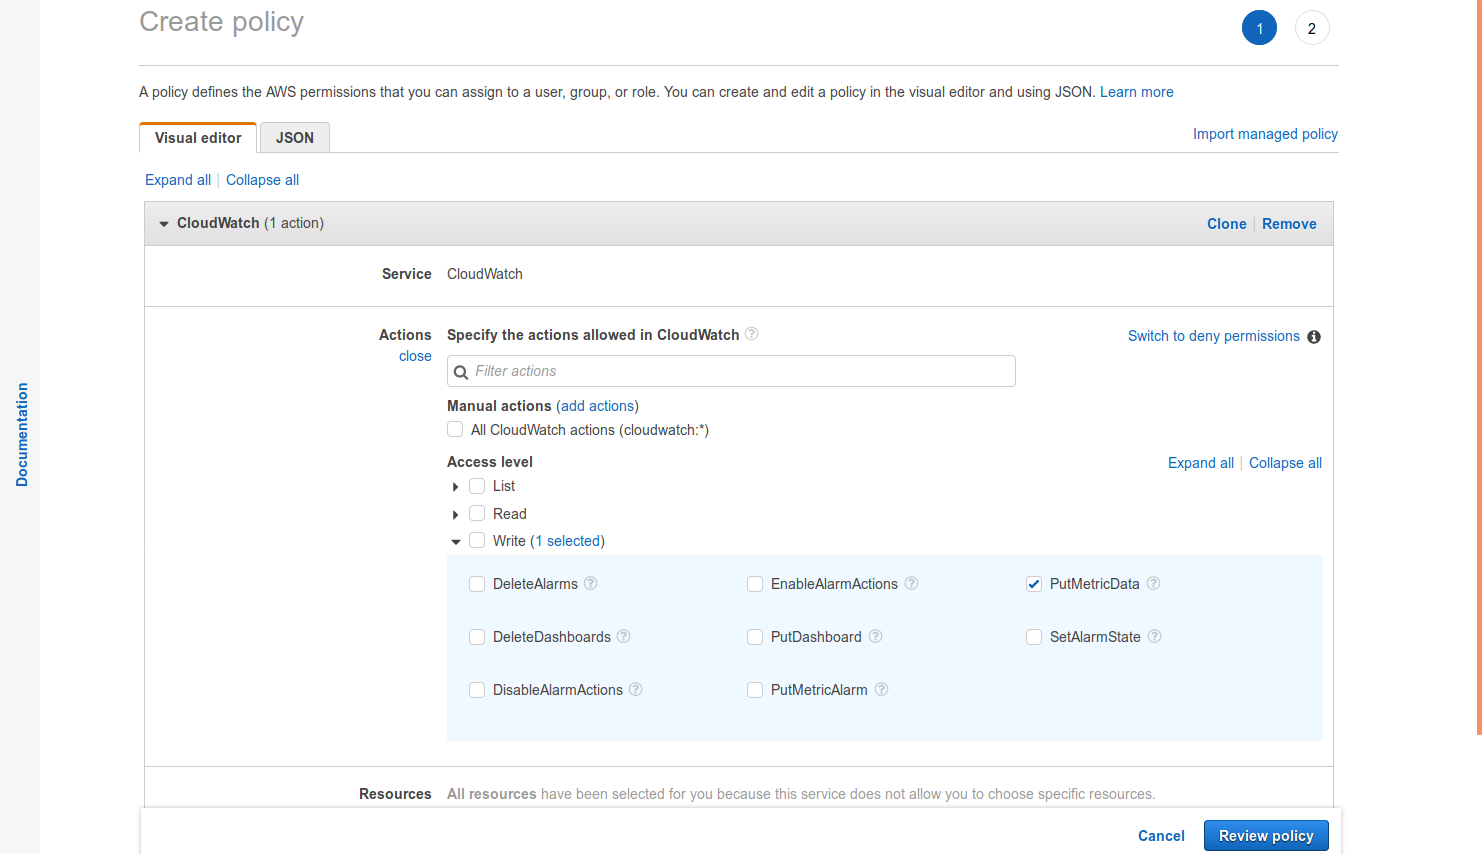
After confirming your selection by clicking on “Next: Permissions”, we have to create a new IAM Policy. Click on “Create Policy” and then select “CloudWatch” as the service you want to access. Then, select “PutMetricData” from the “Write” permissions and click on “Review policy”.
In the next screen, you can give give the policy a name (e. g. “CloudWatch-putMetricDataPermission”) and confirm everything by clicking on “Create Policy”.
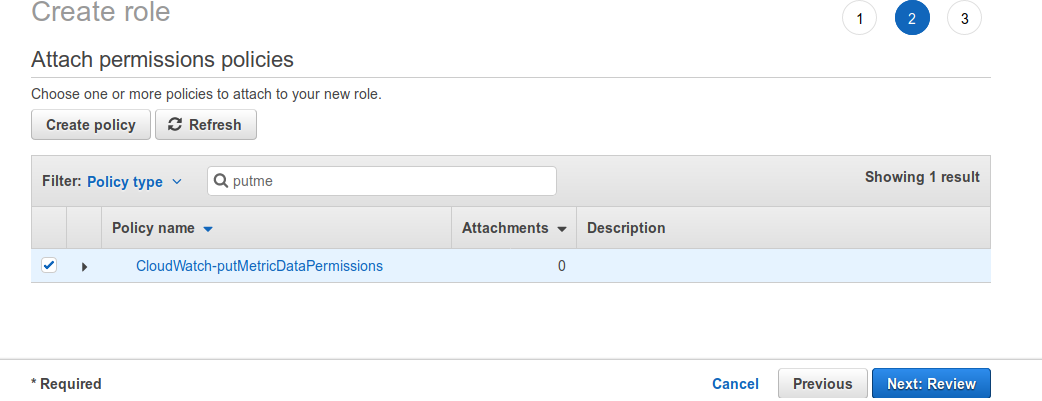
Now back to the tab where you were creating the new role. Click on the “Refresh” button, then find and select the newly created policy in the list. Once that’s done, click on “Next: Review”.
Finally, enter a role name (e.g. “watchtower-role”) and complete the process with a click on “Create Role”.
Creating the Lambda Function
Now we’re ready to set up the monitoring script. Navigate to the AWS Lambda service from your AWS dashboard and click on “Create a function”. Enter a function name (e. g. “Watchtower-ping”), select the Node.js runtime and pick the IAM role you’ve just created. Confirm by clicking on “Create function”.
Now you should see the function configuration. Scroll down to see the text editor. You could create your own monitoring script — which would probably take you an hour or two. Alternatively, you can go with the one I’ve prepared for this guide! Simply get the contents of index.js from the lambda-watchtower GitHub repository and paste them into the text editor of the Lambda configuration page.
Let’s make sure everything is working according to plan. AWS Lambda allows us to try our function with a test event. In order to do that, click on the “Test” button and create a new test case with the parameters of your choice. If you’re using lambda-watchtower, your test event could look something like the following snippet. For more information about configuring lambda-watchtower, check out the documentation.
{
  "targets": [
    {
      "url": "[https://www.example.com](https://www.example.com)",
      "name": "example.com"
    }
  ],
  "timeout": 5000,
  "namespace": "Watchtower"
}
Give your test case a name and confirm the test parameters by clicking on “Create”. Now, all you need to do is click on “Save” before you can click on “Test” once again. This will run the newly created function with the test event you’ve just created.
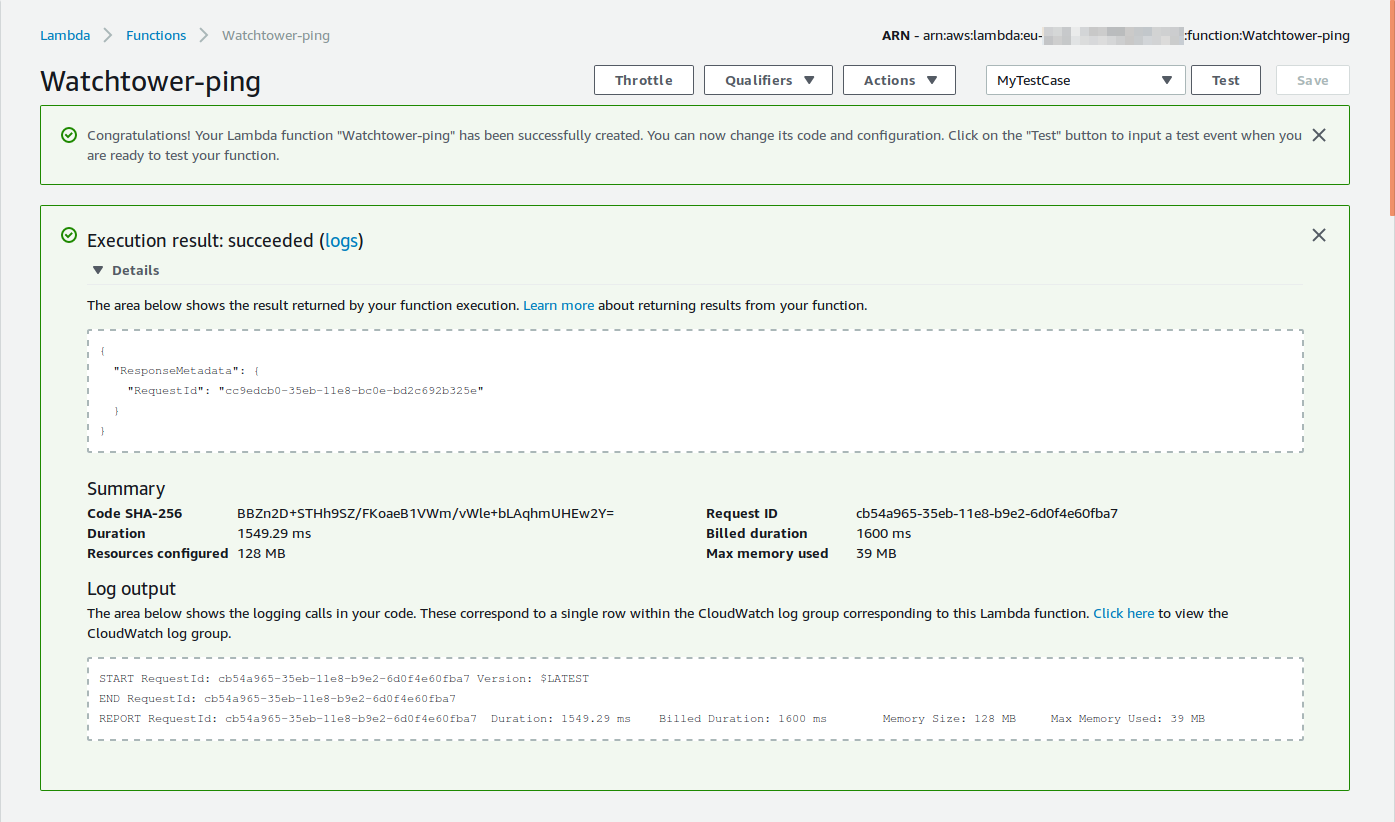
If everything went according to plan, you should see no errors and the execution statistics from the script.
Configuring a CloudWatch Rule
Now that the Lambda script has been set up, you only need to make sure it gets run every five minutes (or any other interval you prefer). This is possible with CloudWatch Rules. Go to the CloudWatch service from your AWS dashboard and select “Rules” from the left-hand menu. Click on “Create rule” and select “Schedule” as your event source. You can now choose the execution interval for the monitoring script. Running the script every five minutes is usually a good choice; shorter intervals might incur additional fees.
Next, click on “Add target” and select the Lambda function you’ve created earlier. Click on “Configure input” and select “Constant (JSON text)”. Paste your script parameters in the input field below. Confirm everything by clicking on “Configure details”. Type in a fitting name (e. g. “watchtower-rule”) and finalize everything with a click on “Create rule”.
Accessing the Logs
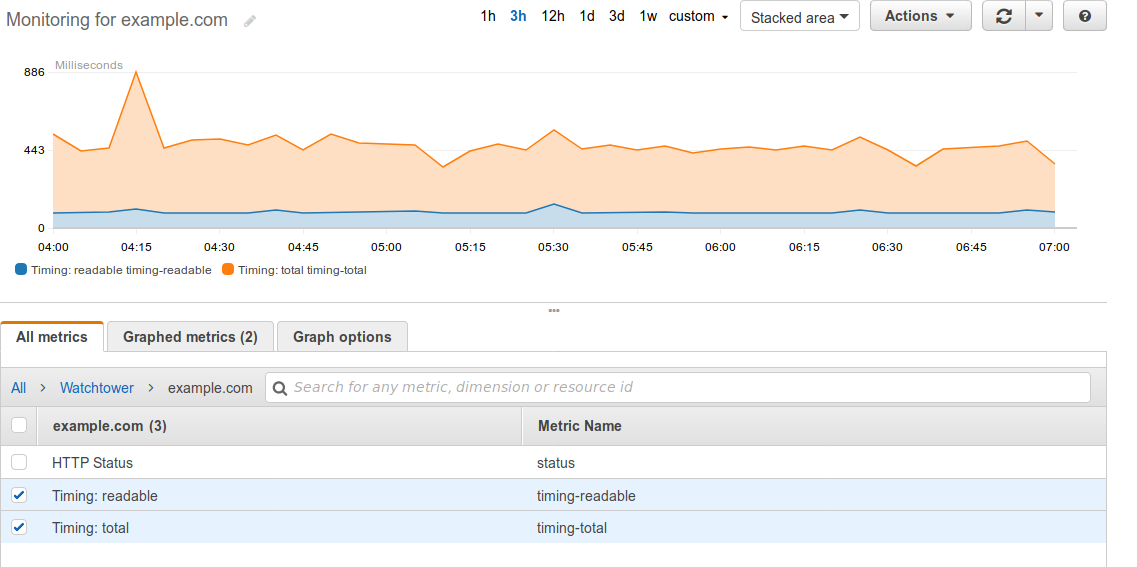
Now that you’ve successfully set up monitoring with Lambda and CloudWatch, it’s time to take a look at the data that is being stored. On the CloudWatch service, select “Metrics” from the navigation on the left. Then click on the namespace you’ve chosen for the logs (e.g. “Watchtower”). In the case of lambda-watchtower, you’ll see the names of your endpoints and by clicking on one of them you’ll see the detailed statistics that were recorded. If you’ve only just set up the monitoring script, the logs are going to contain only one or two data points. But soon, it should look something like this:
That’s it! You now have a fully functional HTTP(S) monitoring service running with AWS Lambda and CloudWatch.
If you have any questions or suggestions for improvements, please let me know! Pull requests for lambda-watchtower are also welcome.
Credit Where Credit Is Due
Thanks to Péter Martón for his article on Measuring HTTP Timings with Node.js which is a great explanation of the event sequence and significance in Node’s http(s) module and helped me tremendously in creating lambda-watchtower.